¶ Level Chart
A widget to represent tank level.
¶ Overview
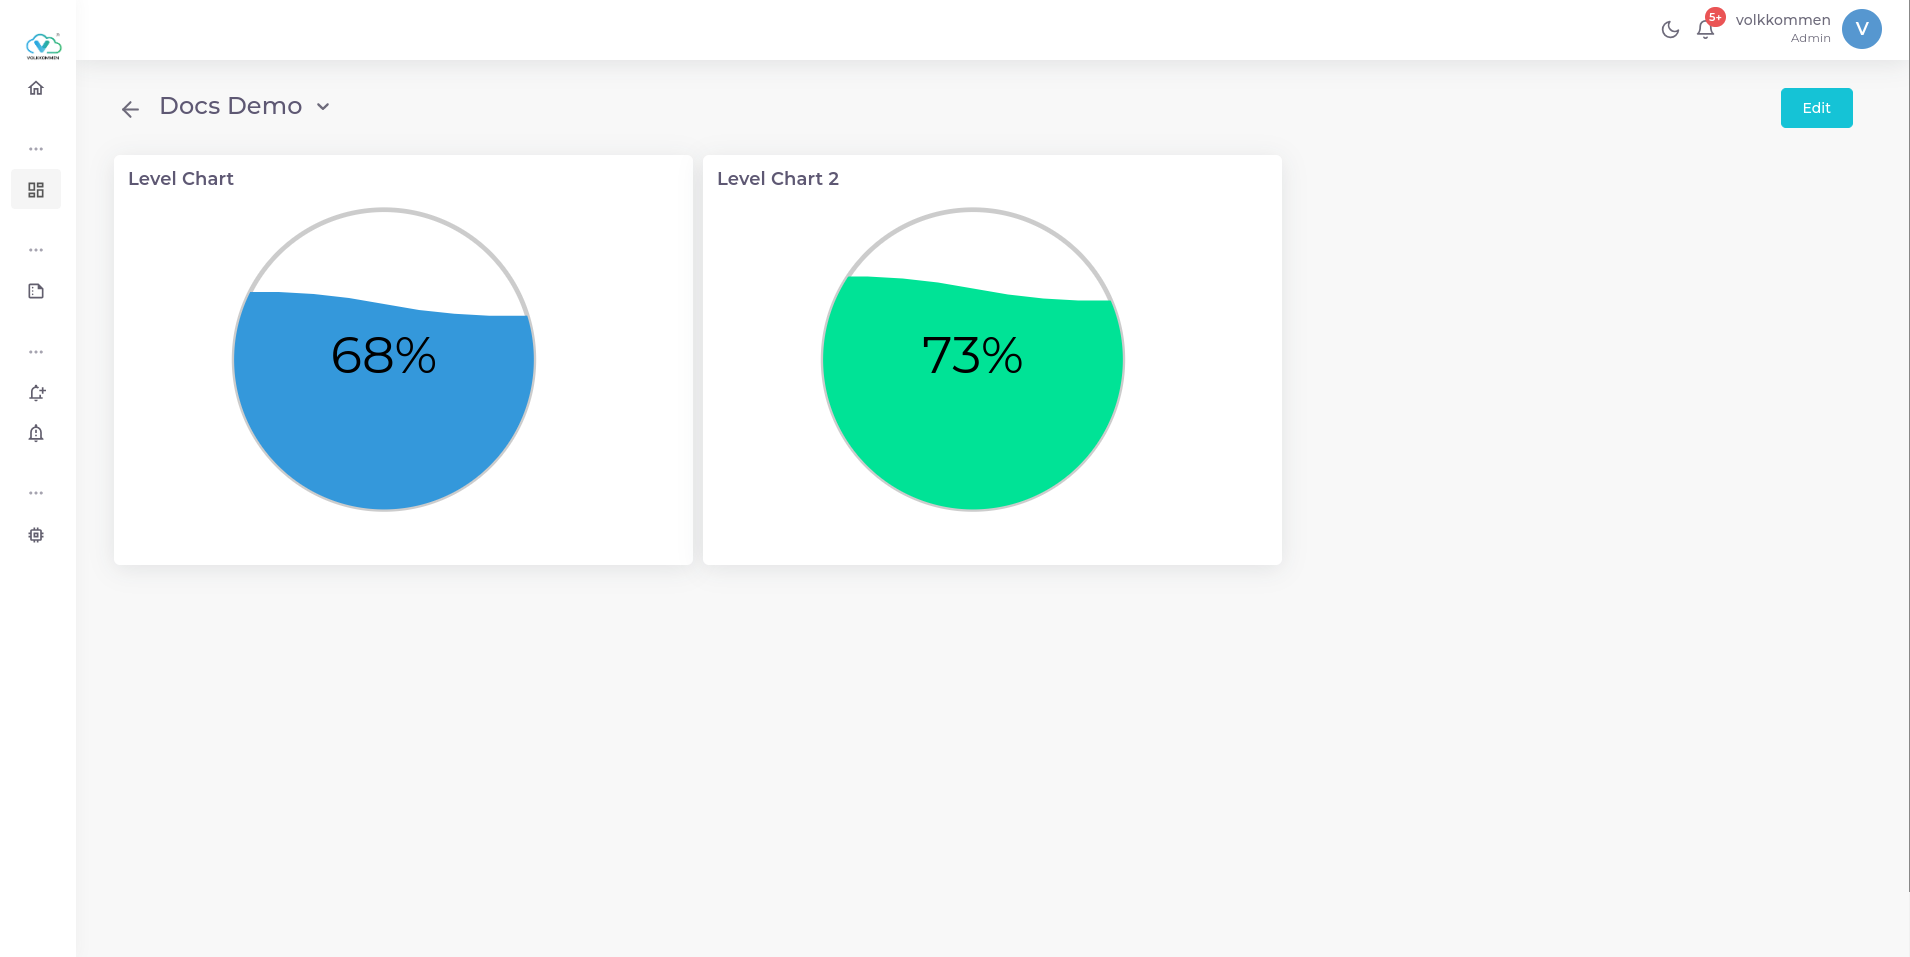
The Level Chart Widget is designed to visually represent the liquid level in a tank or container.
Key Features:
- Displays the latest value in percentage.
- Specially designed for monitoring tank levels or similar applications.
- Includes liquid movement animations for a more appealing and dynamic visual representation.
If you need to monitor tank levels or similar liquid-based measurements, this widget is the perfect choice!
¶ Data
At the bottom of the screen, you will find:
- A device selection dropdown to choose a single device.
- A parameter selection dropdown to pick the desired parameter.
Once selected, the widget will display the current level inside the container, providing a real-time visual representation of the data.
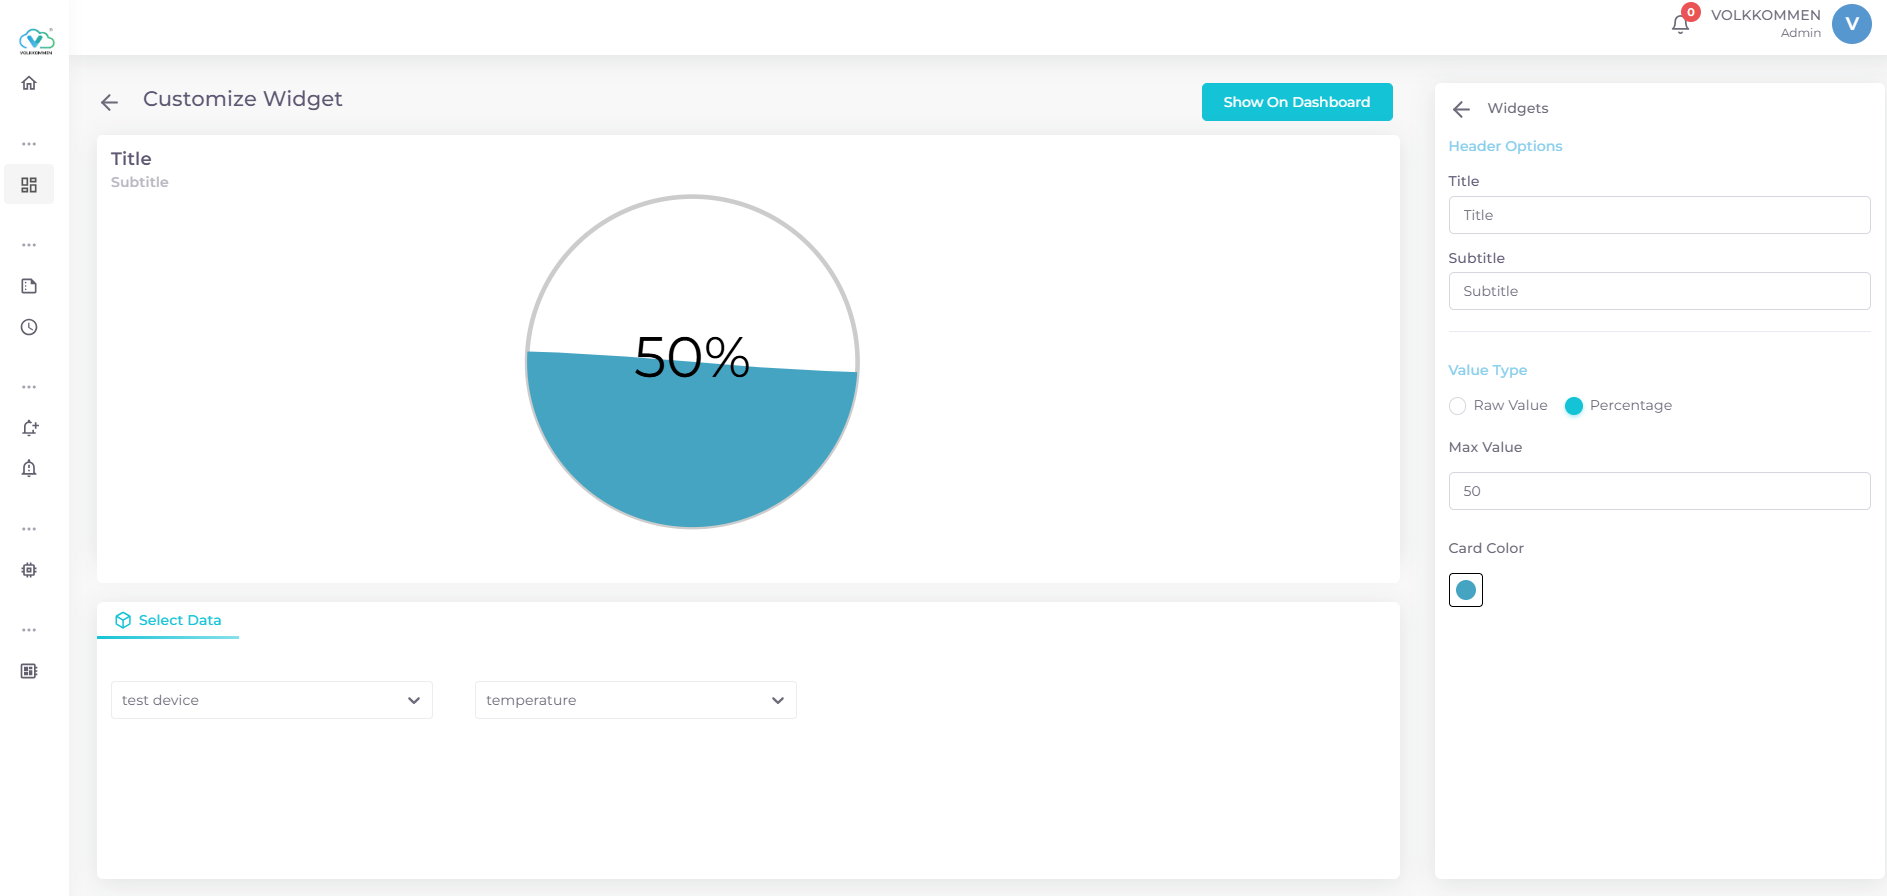
¶ Configuration
In the edit window, you can customize your Level Chart Widget with the following options:
- Title Input Box – Enter a title for your widget.
- Subtitle Input Box – Add a subtitle for additional context.
- Color Picker – Select a desired color for the widget.
- Value Type Selection – Choose between displaying the data as a Raw Value or a Percentage using radio buttons.
- Max Value Input – Set the maximum value for the level chart.
- Save & Display – Click "Show on Dashboard" to view the widget on your dashboard.
Once these steps are completed, your widget is ready to be used!!